|
|
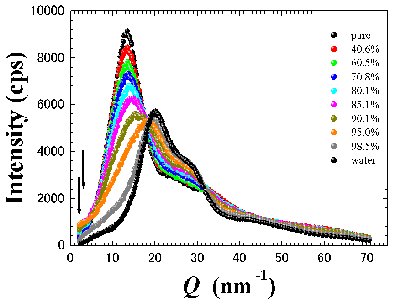
Fig. 1. |
|
|
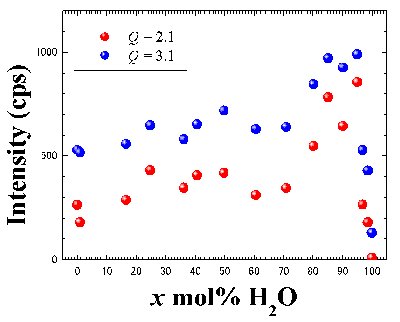
Fig. 2. H2O concentration dependence of intensity of the low-Q component in WAXS. Q positions are 2.1 nm.1 and 3.1 nm-1, which are provided by the allowances in Figure 1. |
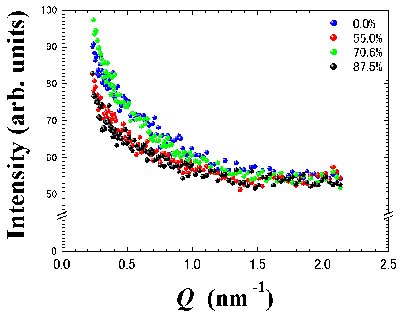 |
Fig. 3. SAXS intensities as a function of the H2O concentration. |
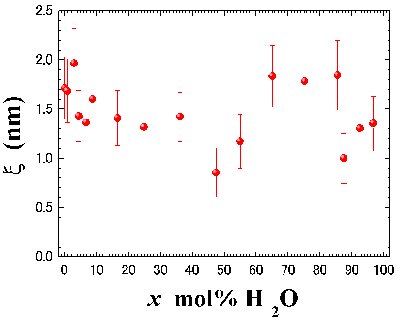 |
Fig. 4. H2O concentration dependence of correlation length x, which is obtained with the Ornstein-Zernike correlation function. |
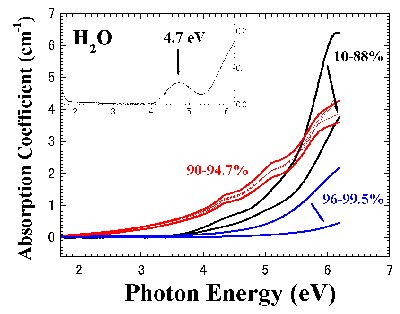 |
Fig. 5. Optical absorption spectra as a function of water concentration. The inset shows the absorption spectrum of pure water. |
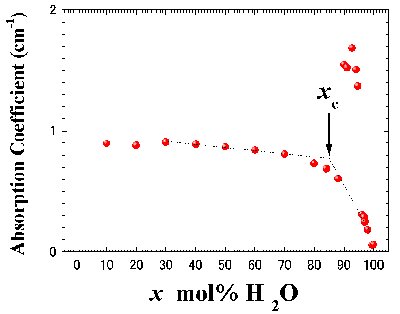 |
Fig. 6. Water concentration dependence of the optical absorption coefficient at 4.7 eV. |
References
1. D.A. Allen, R.A. Howe, N.D. Wood, and W.S. Howells: J. Phys.: Condens. Matter, 1992, vol. 4, pp. 1407-18.
2. M. Salanne, C. Simon, P. Turq, and P.A. Madden: J. Phys.: Condens. Matter, 2008, vol. 20, pp. 2101-15.
3. W. Welton: Chem. Rev., 1999, vol. 99, pp. 2071-83.
4. W. Leitner: Pure Appl. Chem., 2004, vol. 76, pp. 635-44.
5. H. Katayanagi, K. Nishikawa, H. Shimozaki, K. Miki, P. Westh, and Y. Koga: J. Phys. Chem. B, 2004, vol. 108, pp. 19451-57.
6. K.R. Seddon, A. Stark, and M-J Torres: Pure Appl. Chem., 2000, vol. 72, pp. 2275-87.
7. M. Deetlefs, C. Hardacre, M. Nieuwenhuyzen, O. Sheppard, and A. K. Soper: J. Phys. Chem. B, 2005, vol. 109, pp. 1593-98.
8. A. Triolo, O. Russina, H-J. Bleif, and E.D. Cola: J. Phys. Chem. B, 2007, vol. 111, pp. 4641-44.
9. J. Bowers, C.P. Butts, P.J. Martin, M.C. Vergara-Guterrez, and R.K. Heenan: Langmuir, 2004, vol. 20, pp. 2191-98.
10. W. Jiang, Y. Wang, and G.A. Voth: J. Phys. Chem. B, 2007, vol. 111, pp. 4812-18.
11. T. Sato, G. Masuda, and K. Takagi: Electrochim. Acta, 2004, vol. 49, pp. 3603-11.
12. H. Abe, Y. Imai, T. Takekiyo, and Yukihiro Yoshimura: J. Phys. Chem. B, 2010, vol. 114, pp. 2834-39.
13. H.E. Stanley: Introduction to Phase Transition and Critical Phenomena, Oxford University Press, New York, NY, 1971.
14. D.R. Barker, M. Wilson, P.A. Madden, N.N. Medvedev, and A. Geiger: Phys. Rev. E, 2000, vol. 62, pp. 1427-30.
15. A. Paul, P.K. Mandal, and A. Samanta: Chem. Phys. Lett., 2005, vol. 402, pp. 375-79.
16. S. Mahanta, R.B. Singh, S. Kar, and N. Guchhait: Chem. Phys., 2008, vol. 354, pp. 118-29.
Last Modified: April 1, 2011