|
|
Fig. 1 |
|
|
Fig. 2 Schematic DTA warm-up traces of (a) 55.0, (b) 85.0 and (c) 90.1 mol% H2O mixed solutions. At x = 85.0 mol% H2O, an exothermic crystallization-like peak appeared at around T = 168 K just after the first Tg. |
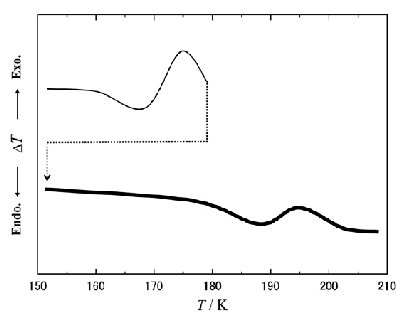 |
Fig. 3. The re-quenching procedure for detecting the Tg2 at x = 85.0 mol% H2O. The thin solid line corresponds to the first run, and the dotted line represents the requenching process. After the re-quenching, a clear downward Cp shift was observed as the Tg2 in the second run (thick line). |
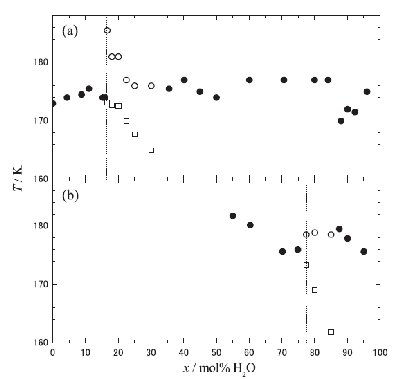 |
Fig. 4. Plot of Tg as a function of x mol% H2O, (a) [DEME][BF4]-H2O and (b) [DEME][I]-H2O mixed solutions. Symbols of *, * and * stand for Tg, Tg1 and Tg2, respectively. The Tg data of [DEME][BF4]-H2O mixed solutions [11] are shown for comparison. The dotted vertical lines are only guides for the eye. |
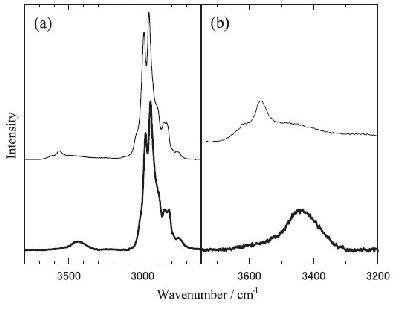 |
Fig. 5. Comparison of the Raman spectra between [DEME][I]-H2O (thick line) and [DEME][BF4]-H2O (thin line) at the corresponding water concentration (x = 55 mol% H2O) in the liquid state. Peak intensities are normalised by the strongest peak of CH stretching vibrational mode of [DEME] cation. (a) The CH and OH stretching vibrational modes of the solutions and (b) the enlarged OH stretching vibrational region. |
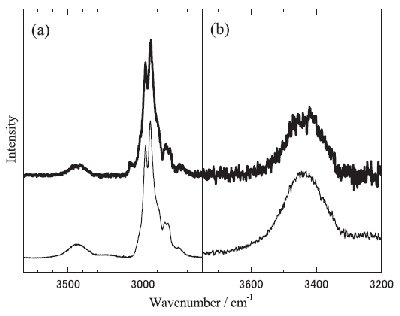 |
Fig. 6. The Raman spectra of [DEME][I]-H2O solution (x = 80.0 mol% H2O) in (a) the CH and OH and (b) the OH stretching vibrational region at T = 297 K (thin line) and T = 77 K (thick line). |

References
[1] T. Sato, G. Masuda, K. Takagi, Electrochim. Acta 49 (2004) 3603-3611.
[2] M.J. Earle, P.B. McCormac, K.R. Seddon, Green Chem. (1999) 23-25.
[3] D. Kerle, R. Ludwig, A. Geiger, D. Paschek, J. Phys. Chem. B 113 (2009) 12727-12735.
[4] M. Galin´ ski, A. Lewandowski, I. Ste.pniak, Electrochim. Acta 51 (2006) 5567-5580.
[5] G. Raabe, J. Koehler, J. Chem. Phys. 128 (2008) 154509.
[6] D. Xiao, J.R. Rajian, A. Cady, S.F. Li, R.A. Bartsch, E.L. Quitevis, J. Phys. Chem. B111 (2007) 4669-4677.
[7] Y.T. Wang, G.A. Voth, J. Ame. Chem. Soc. 127 (2005) 12192-12193.
[8] W. Jiang, Y.T. Wang, G.A. Voth, J. Phys. Chem. B 111 (2007) 4812-4818.
[9] S. Feng, G.A. Voth, Fluid Phase Equilib. 294 (2010) 148-156.
[10] Y. Yoshimura, T. Goto, H. Abe, Y. Imai, J. Phys. Chem. B 113 (2009) 8091-8095.
[11] Y. Imai, H. Abe, T. Miyashita, T. Goto, H. Matsumoto, Y. Yoshimura, Chem. Phys. Lett. 486 (2010) 37-39.
[12] Y. Yoshimura, S. Namekata, H. Kanno, J. Solution Chem. 30 (2001) 213-221.
[13] H. Kanno, A. Ohnishi, K. Tomikawa, Y. Yoshimura, J. Raman Spectrosc. 30 (1999) 705-713.
[14] Y. Imai, H. Abe, T. Goto, Y. Yoshimura, Y. Michishita, H. Matsumoto, Chem. Phys. 352 (2008) 224-230.
[15] H. Kanno, K. Shimada, K. Katoh, Chem. Phys. Lett. 103 (1983) 219-221.
[16] H. Kanno, K. Shimada, Y. Yoshino, T. Iwamoto, Chem. Phys. Lett. 112 (1984) 242-245.
[17] H. Kanno, K. Shimada, K. Katoh, J. Phys. Chem. 93 (1989) 4981-4985.
[18] G.S. Fulcher, J. Am. Ceram. Soc. 6 (1925) 339-355.
[19] L. Cammarata, S.G. Kazarian, P.A. Salter, T. Welton, Phys. Chem. Chem. Phys. 3 (2001) 5192-5200.
[20] H. Kanno, J. Hiraishi, J. Phys. Chem. B 87 (1983) 3664-3670.
[21] R. Kiefer, S.Y. Shu, P.A. Kilmartin, G.A. Bowmaker, R.P. Cooney, J. T-Sejdic, Electrochim. Acta 52 (2007) 2386-2391.
[22] H.D.B. Jenkins, H.K. Roobottom, J. Passmore, L. Glasser, Inorg. Chem. 38 (1999) 3609-3620.
[23] M.S. Sethi, M. Satake, Periodic Tables and Periodic Properties, Discovery Publishing House, Delhi, 2003.
[24] H. Abe, Y. Imai, T. Takekiyo, Y. Yoshimura, J. Phys. Chem. B 114 (2010) 2834-2839.
[25] E.R. Nightingale Jr., J. Phys. Chem. 63 (1959) 1381-1387.
[26] S. Lindenbaum, G.E. Boyd, J. Phys. Chem. 68 (1964) 911-917.
[27] Y. Jeon, J. Sung, C. Seo, H. Lim, H. Cheong, M. Kang, B. Moon, Y. Ouchi, D. Kim, J. Phys. Chem. B 112 (2008) 4735-4740.
Last Modified: April 1, 2011