|
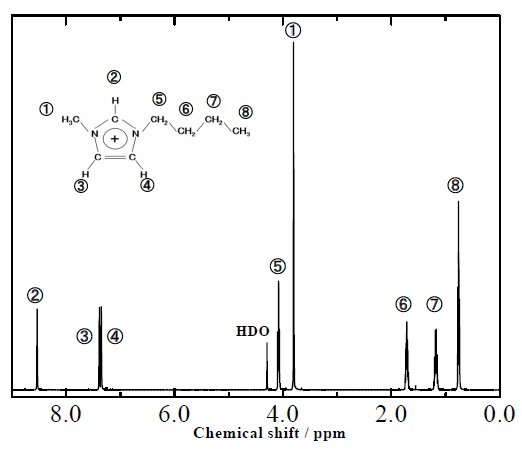 |
Figure 1. |
|
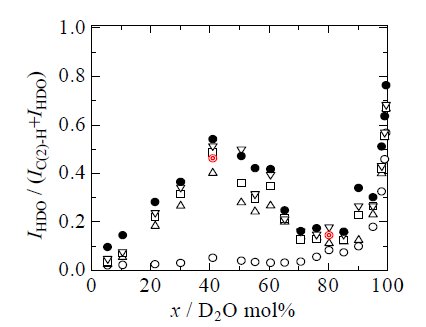
Figure 2. The intensity ratio of the IHDO/(IC(2)-H + IHDO) for [bmim][BF4]-D2O mixed solution against the D2O concen-tration x. The extent of a deuterium exchange is examined with time evolution from 0 - 42 days. The symbols show the data depicted. ��: 0 day, ��: 14 days, ��: 23 days, ��: 29 days, ��: 42 days, ��: heated for 2 hours at 75��C immedi-ately after the sample preparations. |
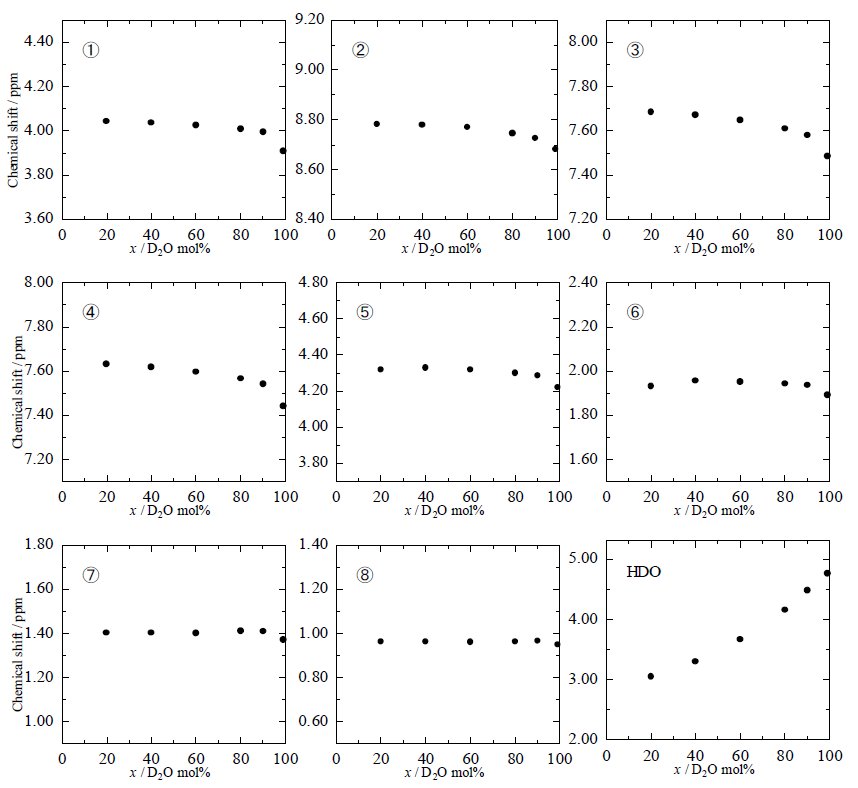 |
Figure 3. Chemical shifts of respective protons in [bmim] cation and HDO as a function of water concentration x. The chemical shifts correspond to the deviations from the position of the reference (DSS). |
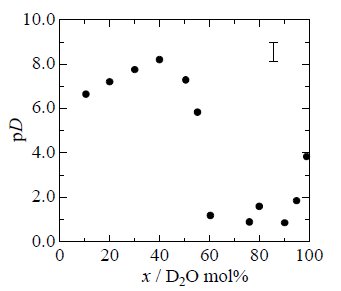 |
Figure 4. Concentration dependence for the pD of [bmim] [BF4]-D2O mixed solutions. The values for the mixed solu-tions after 42 days from the sample preparation are plotted. |
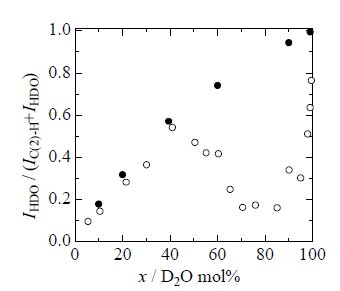 |
Figure 5. The intensity ratio (IHDO/(IC(2)-H + IHDO)) of the H/D exchange reaction in buffered solutions at a basic con-dition (adjusted to pD = 11 - 12) against the D2O concentration x. For a comparison, the values for the mixed solutions without the addition of the base (open circle symbols) after 42 days left from the sample preparation are plotted in the same figure. |
References
[1] T. Welton, �gIonic Liquids in Synthesis�h, (Wiley-VCH, Weinheim, 2002).
[2] R. D. Rogers, K. R. Seddon and S. Volkov, �gGreen In-dustrial Applications of Ionic Liquids�h, (NATO Science Series, Springer, New York, 2002).
[3] Y. Jeon, J. Sung, D. Kim, C. Seo, H. Cheong, Y. Ouchi, R. Ozawa and H. Hamaguchi, J. Phys. Chem. B 112 (2008) 923-928.
[4] L. Cammarata, S. G. Kazarian, P. A. Salter and T. Welton, Phys. Chem. Chem. Phys. 3 (2001) 5192-5200.
[5] Y. Yoshimura, T. Goto, H. Abe and Y. Imai, J. Phys. Chem. B 113 (2009) 8091-8095.
[6] Y. Yoshimura, H. Kimura, C. Okamoto, T. Miyashita, Y. Imai and H. Abe, J. Chem. Thermodyn. 43 (2011) 410-412.
[7] H. Jin, X. Li and M. Maroncelli, J. Phys. Chem. B 111 (2007) 13473-13478.
[8] A. Paul, P. Kumar and A. Samanta, Chem. Phys. Lett. 402 (2005) 375-379.
[9] Z. Hu and C. Margulis, Proc. Nat. Acad. Sci. USA 103 (2006) 831-836.
[10] M. Moreno, F. Castiglione, A. Mele, C. Pasqui and G. Raos, J. Phys. Chem. B 112 (2008) 7826-7836
[11] W. Jiang, Y. Wang and G. A. Voth, J. Phys. Chem. B 111 (2007) 4812-4818.
[12] M. Nakakoshi, S. Ishihara, H. Utsumi, H. Seki, Y. Koga and K. Nishikawa, Chem. Phys. Lett. 427 (2006) 87-90.
[13] Y. Yasaka, C. Wakai, N. Matubayashi and M. Nakahara, J. Phys. Chem. A 111 (2007) 541-543.
[14] H. Maity, W. Kilim, J. N. Rumbley and S. W. Englander, Protein Sci. 12 (2003) 153-160.
[15] C. K. Woodward and B. D. Hilton, Annual Rev. Biophys. Bioeng. 8 (1979) 99-127.
[16] Y. Bai, J. S. Milne, L. Mayne and S. W. Englander, Proteins: Structure, Function, and Bioinformatics 17 (1993) 75-86.
[17] C. A. Wamser, J. Am. Chem. Soc. 73 (1951) 409-416.
[18] M. Anbar and S. Guttmann, J. Phys. Chem. 64 (1960) 1896-1899.
[19] P. K. Glasoe and F. A. Long, J. Phys. Chem. 64 (1960) 188-190.
[20] J. D. Holbrey and K. R. Seddon, J. Chem. Soc. Dalton Trans. 13 (1999) 2133-2140.
[21] J. A. Pople, W. G. Scheneider and H. J. Bernstein, �gHigh- Resolution Nuclear Magnetic Resonance�h, (McGraw-Hill, New York, 1959).
[22] F. Franks, �gWater, A Comprehensive Treatise�h, (Plenum Press, New York, 1972).
[23] J. M. Harvey, S. E. Jackson and M. C. R. Symons, Chem. Phys. Lett. 47 (1977) 440-441.
[24] P. K. Kipkemboi, P. C. Kiprono and A. J. Easteal, Bull. Chem. Soc. Ethiopia 16 (2002) 187- 198.
[25] J. G. Huddleston, A. E. Visser, W. M. Reichert, H. D. Willauer, G. A. Broker and R. D. Rogers, Green Chem. 3 (2001) 156-164.
[26] M. Tseng, Y. Liang and Y. Chu, Tetrahedron Lett. 46 (2005) 6131-6136.
[27] M. G. Freire, C. M. S. S. Neves, I. M. Marrucho, J. A. P. Coutinho and A. M. Fernandes, J. Phys. Chem. A 114 (2010) 3744-3749.
[28] T. L. Amyes, S. T. Diver, J. P. Richard, F. M. Rivas and K. Toth, J. Am. Chem. Soc. 126 (2004) 4366-4374.
[29] J. Dupont and J. Spencer, Ang. Chem. Int. Ed. 43 (2004) 5296-5297.
[30] S. T. Handy and M. Okello, J. Org. Chem. 70 (2005) 1915-1918.
[31] O. Holloczki, P. Terleczky, D. Szieberth, G. Mourgas, D. Gudat and L. Nyulaszi, J. Am. Chem. Soc. 133 (2011) 780-789.
Last Modified: Mar. 1, 2012